The Ranking, From Vanity to Profit
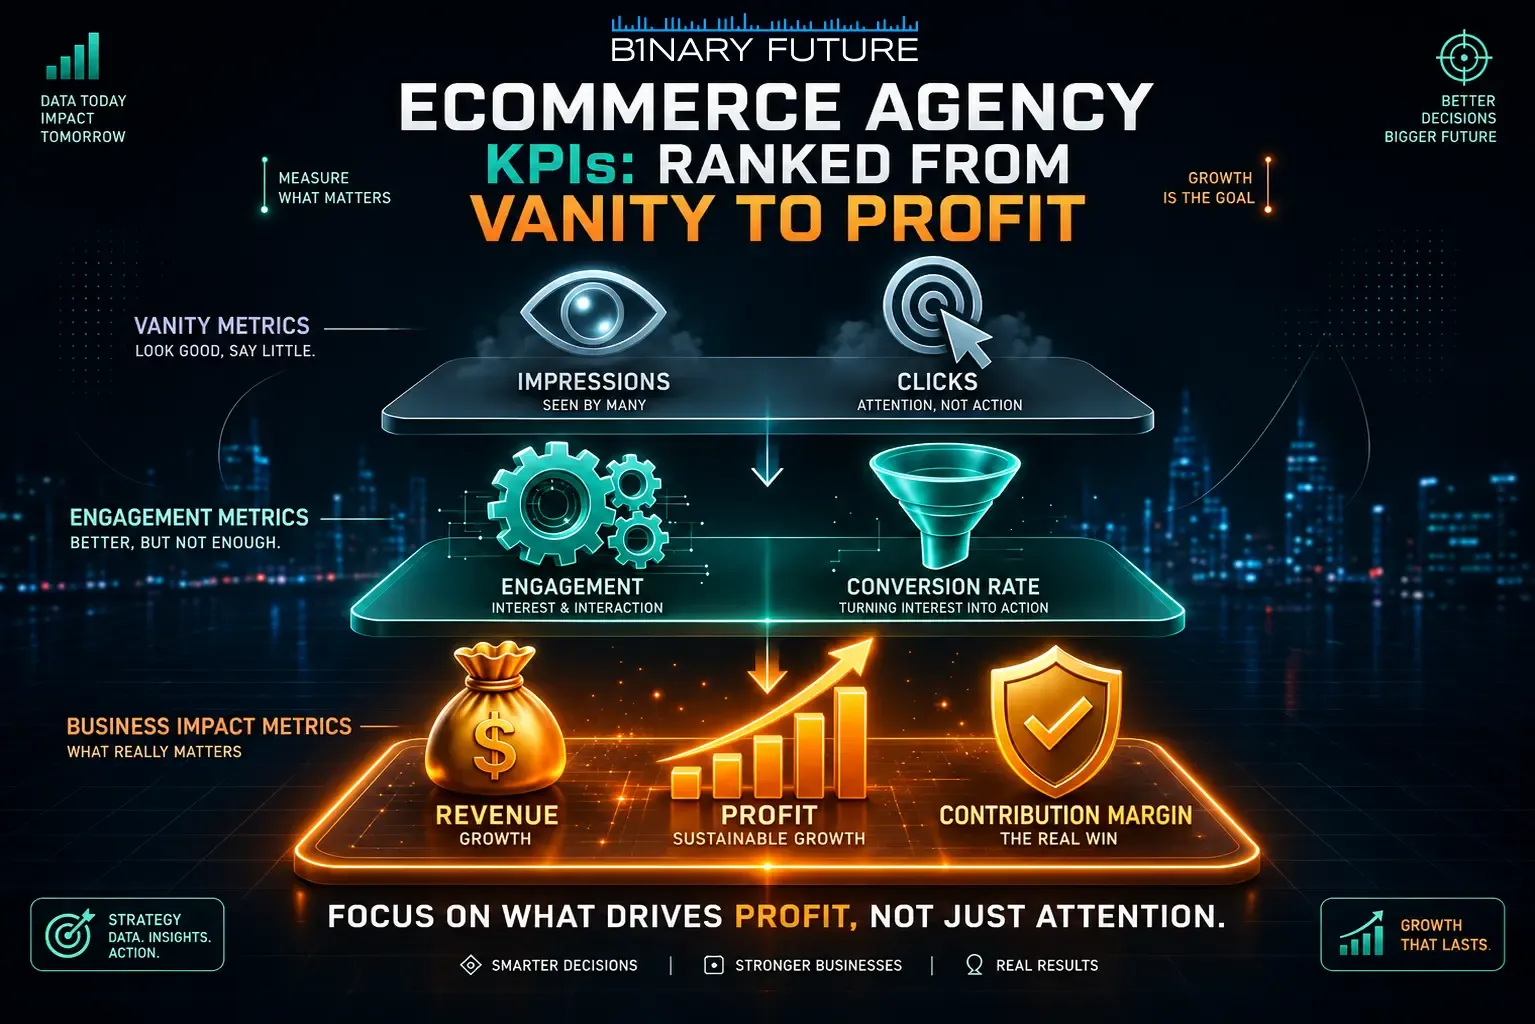
Eight numbers, ordered by how close each one sits to the money you keep. The right column is the one to read before signing anything.
| KPI | What it tells you | Who moves it |
| Impressions and clicks | That reach was bought | Marketing |
| Platform ROAS | What each ad platform credits to itself | Marketing |
| Conversion rate | How many visits become orders | Development and marketing together |
| Average order value | What one order is worth | Marketing, merchandising and the store |
| MER | Total store revenue per dollar of total ad spend | Both teams, across every channel |
| New customer acquisition cost | What one first-time buyer costs, all channels included | Both teams |
| Repeat purchase rate | Whether buyers come back | Email, retention and the product itself |
| Contribution margin after marketing | What is left after product, shipping, fees, discounts and ads | Both teams, plus pricing |
The top three are useful inside a channel and misleading across channels. Platform ROAS in particular lets Google, Meta and email each claim the same order, which is why it reads well in every channel report and adds up to more revenue than the store took.
Read These Four First
The bottom half of the list is where an agency’s work meets your margin. Each number needs a written definition, because each can be calculated several ways.
- Contribution margin after marketing. Revenue minus cost of goods, shipping, payment fees, discounts and all ad spend. It is the number that pays salaries. An agency that cannot see your cost of goods cannot report it, and that tells you which decisions it is making without the full picture.
- Repeat purchase rate. The share of customers who order again within a window you set, for example 90 days for consumables. Email flows, subscriptions and the product move it; acquisition campaigns rarely do.
- New customer acquisition cost. Total ad spend divided by first-time buyers in the same period. Mixing returning customers into the denominator makes acquisition look cheaper than it is, and the cash flow notices before the report does.
- MER, or marketing efficiency ratio. Total store revenue divided by total ad spend, with revenue taken from Shopify rather than from the ad platforms. It ignores attribution completely, which is its main strength: no platform can claim credit inside it.
One date explains why the bottom of the list mattered more in 2026. On August 26, 2026, non-Plus stores were moved to the new checkout and legacy customizations were removed rather than migrated. Where purchase tracking lived in one of them, platform ROAS and reported conversions fell while orders did not. MER and contribution margin come from the store’s own records, so they stayed where they were.
The Number Only a Combined Team Can Report
If one company runs the ads and another builds the store, nobody owns the time between “the data says the checkout loses mobile buyers” and “the fix is live”. That interval is a KPI too, and the most direct measure of what a single ecommerce agency is for.
- Finding to release time. Days from a documented finding, in ad data, analytics or a test, to the change shipping in production. Track the median every quarter.
- Share of findings shipped. Of everything the report flagged last quarter, how much reached the store. A low share means the report produces ideas that nobody builds.
- Release impact on the same scorecard. Every release is checked against the numbers above, with its date marked on the chart, so a change in conversion rate can be traced to the week it happened.
Shopify made the last one easier this autumn. The Fall ’26 Edition introduced Rollouts, which group theme, checkout, catalog price and discount changes into one scheduled launch that can be rolled back. A release with a date and an undo button is a release you can measure.
Setting the Scorecard Before the First Invoice
The scorecard belongs in the contract, not in a slide from the first monthly report. Four things to fix in writing:
- Definitions. Which revenue, gross or net of returns. Which spend, media only or media plus fees. Which time window. Two honest people can produce different MER figures from the same store with different definitions.
- Source of truth. Shopify for revenue and orders, your accounting for cost of goods, the ad platforms only for spend.
- Cadence. Channel numbers weekly, the bottom half monthly, contribution margin at least quarterly.
- What happens when a number moves. Who must notice, within how many days, and what they owe you: an explanation, a fix or a test.
Binary Future is an ecommerce agency that runs marketing and Shopify development as one team, so the scorecard covers the ad account and the store on the same page, and a finding in one becomes a ticket in the other. See how our ecommerce marketing services connect to the store work, and what each type of ecommerce agency owns and leaves off its reports.